Click chart for enlargement
Selected Economic Indicators Newfoundland and Labrador:
1998-2000f1998
1999
2000f
GDP at market prices ($m)
% change
10,871
6.3
11,638
7.1
13,025
11.9GDP at market prices (92$m)
% change real
10,491
6.2
11,051
5.3
11,568
4.7Personal Income ($m)
% change
% change real
10,054
1.5
1.3
10,490
4.3
2.8
10,888
3.8
1.3Personal Disposable Income ($m)
% change
% change real
7,872
0.4
0.2
8,230
4.6
3.1
8,632
4.9
2.3Retail Trade ($m)
% change
% change real
3,884
3.0
4.0
4,150
6.9
5.5
4,360
5.1
2.3Capital Investment ($m)
% change
% change real
2,774
1.3
1.0
3,358
21.0
20.8
3,109
-7.4
-5.0Labour Force (000's)
% change
237.0
1.9
246.7
4.1
250.5
1.6Employment (000's)
% change
194.2
2.6
204.9
5.5
210.6
2.8Unemployment Rate (%)
18.0
16.9
15.9Population (000’s)
% change
545.4
-1.6
541.0
-0.8
541.0
0.0CPI (1992 = 100)
% change108.4
0.2110.0
1.5112.7
2.5Housing Starts
% change1,450
-14.51,371
-5.41,465
6.8Note: f: forecast (Government of Newfoundland and Labrador), March 2000. Statistics Canada; Canada Mortgage and Housing Corporation; Economics and Statistics Branch, Department of Finance.
PROVINCIAL ECONOMIC OVERVIEW
Macroeconomic Performance
Newfoundland and Labrador posted the strongest economic growth of any
province in 1999, for the second year running. Real GDP growth of 5.3% was
powered by gains in exports and capital investment which both reached record
levels. The value of exports grew 13.1% to $5.7 billion and capital
investment grew by 21% to $3.4 billion. Economic gains were broadly-based
and included increases in offshore oil production, crab and shrimp landings,
construction activity, tourism and manufacturing. Manufacturing gains, led
by fish production, newsprint, and refined petroleum, resulted in a record
shipment value of almost $2 billion. Strong economic growth, coupled with
increasing employment, higher wages, low interest rates, and strengthened
consumer confidence, led to an increase of 6.9% in retail sales and 13.7% in
the number of new vehicles sold.
|
||||||||||||||||||
The Province’s real economic growth is expected to be 4.7% in 2000, leading all provinces for a third year. Growth will be driven by increased oil, newsprint and mineral production and higher manufacturing shipments. Higher public sector spending on infrastructure, increased tourism and other service sector activity, and expanding technology industries will also contribute to growth. Employment growth of 2.8% is forecast, causing the unemployment rate to decline to 15.9%. Federal and provincial tax cuts will boost after-tax incomes in 2000. These cuts, combined with employment and wage growth, will encourage further buying by consumers leading to an increase of 5.1% in retail sales and 5.7% in housing investment.
Demographic Overview
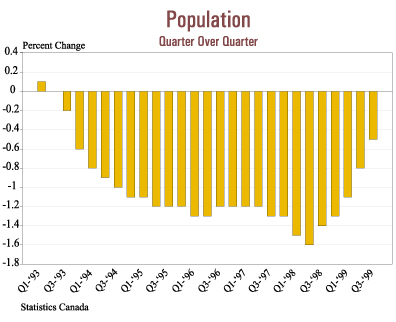
Population began to stabilize in 1999 as net out-migration declined
sharply, continuing a trend begun in 1998 and paving the way for an expected
end to six years of population decline this year.
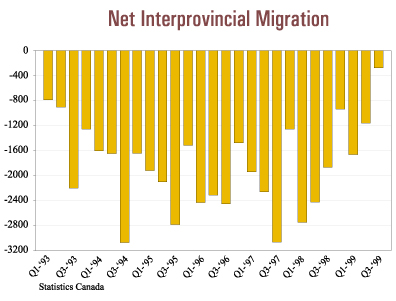
Net out-migration during the 1990s rose to high levels, triggered by employment losses associated with the groundfish closures and exacerbated by, among other things, major EI reforms and government expenditure restraint. Falling natural increase (births minus deaths) compounded the effects of net out-migration, and population decline ensued.
Declining net out-migration over the past year or more reflects three years of increasingly stronger economic and employment growth as well as a substantially completed demographic adjustment to structural changes in the fishing industry and reform of the EI program.
The third quarter of 1999 was particularly noteworthy (data for the fourth quarter of 1999 is not yet available). It marked the fifth consecutive quarter that year-over-year net out-migration declined, and brought interprovincial net out-migration to its lowest third-quarter level in almost two decades. It also brought an end to six and a half years of quarter-to-quarter population decline as the natural increase was just enough to offset net out-migration, leaving population virtually unchanged from the second quarter of 1999.
The population is expected to stabilize in 2000 and beyond as net out-migration continues to moderate, reflecting expectations for strong economic and employment growth. While population decline is not expected to be an issue in the current decade, population aging and regional population shifts will continue to present significant challenges for all provinces.
Labour Market Performance
Labour market performance in 1999 was the strongest in a decade.
Employment averaged 204,900, an increase of 5.5% from 1998. This was the
highest growth rate of all provinces, and double the Canadian growth rate.
The unemployment rate declined to 16.9% from 18.0% in 1998. Job gains were
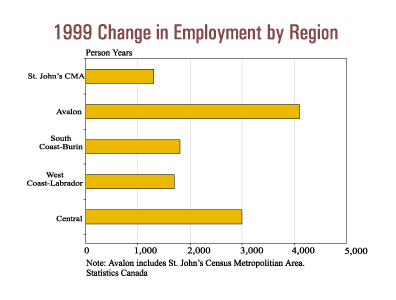
broadly-based, both on a regional and industry basis. Increases were
recorded in the fisheries, retail trade, construction, tourism and
transportation industries. Employment growth outside of the St. John’s
area was particularly strong at 8.1%.
The labour force grew by 4.1% in 1999 reflecting growth in job opportunities. The labour market participation rate, which measures the labour force as a percent of the working age population, increased to 56.3% from 53.9% in 1998.
Strong employment growth, coupled with increased demand for skilled trades and occupations, resulted in growth in average weekly earnings of 2.8% in 1999 and by 1.3% after adjusting for inflation. This was the strongest growth of all provinces and reflected higher public and private sector wage settlements, an increased minimum wage and employers’ need to attract and retain skilled workers in the face of lower unemployment rates and relatively higher wages in other parts of Canada and the United States.
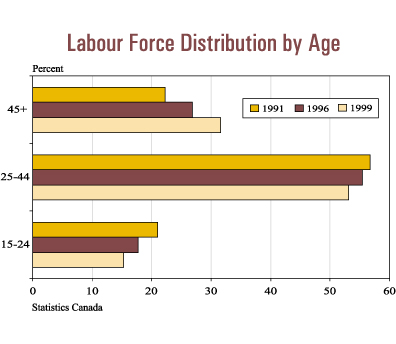
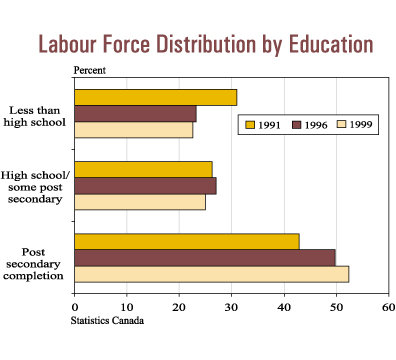
Labour force and employment growth trends are influencing the composition of the labour force. For example, in 1999, 52.2% of the labour force had completed post secondary studies, an increase from 43.1% in 1991. Educational attainment can be expected to increase further as youth now entering the labour market tend to have more education than older workers retiring from the labour market. Furthermore, the demand by employers for highly skilled labour is expected to increase over time. As well, 31.6% of the labour force was age 45 and over in 1999, as compared to 22.3% in 1991. This may mean that over the next 15 years more job opportunities will be available for youth, as up to one-third of today’s labour force reaches retirement age.
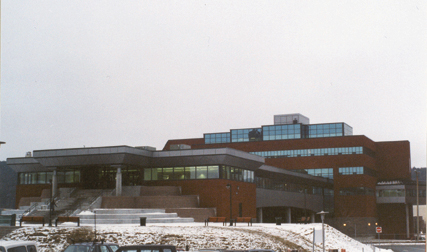
Photo: Paul Chafe, The Muse. (Click on photo to visit The
Muse)
University Centre, Memorial University of Newfoundland - St. John’s Campus.