|
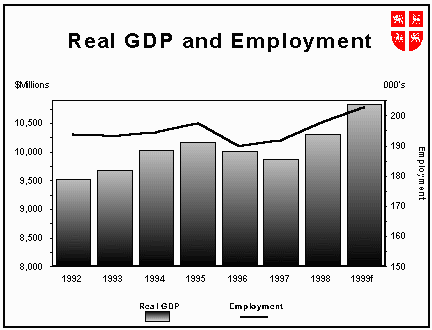
BUDGET PLAN 1998 Economic Review Mr. Speaker, in previous budgets we said that 1996 and 1997 would be difficult years for our economy, but that growth would resume in 1998. This has proven accurate. In fact, in 1998 our economy grew by 4.4%, the greatest of any province and our strongest economic growth this decade. A number of factors contributed to the strong performance:
Employment growth in 1998 was better than expected, coming in at 3.1%, the highest rate of job growth of the 1990s. 6100 more people were working in the Province in January 1999 than in January 1998. Nationally, only Ontario and Alberta had stronger employment growth last year.
1999 Economic Outlook Mr. Speaker, real GDP is expected to show significant growth again in 1999. We are forecasting an increase of 5 percent, led by capital spending on resource developments and further export growth. Private sector forecasters predict that our Province will again lead the country in growth for the second year in a row. A number of factors are fuelling this growth:
Employment is forecast to record a further gain of 2.5%, with a consequential decline in the unemployment rate. Job gains, combined with moderate wage gains, should boost personal income by 2.6% and lead to greater consumer confidence and higher consumer spending.
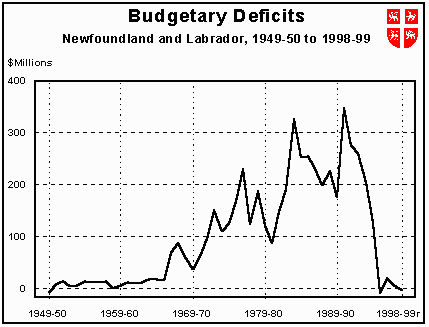
1998-99 Fiscal Performance Mr. Speaker, last spring we forecast a $10 million deficit for 1998-99. I am pleased to report that we are recording a surplus of $4.3 million. This is only the second surplus recorded by any government since our first fiscal year as a Province, 1949-50. In the last three budgets our government forecast cumulative deficits of $75.1 million. We delivered deficits of $21 million. This is the lowest cumulative deficit recorded by any government for any consecutive three year period since the late 1950s. Taking into account the impact of inflation, the cumulative deficit of this government over the past three years is the lowest since Confederation.
The deficit was successfully reduced after the groundfishery had closed, Hibernia construction was completed, federal transfer payments for social programs were cut by $100s of millions and while GDP declined by 1.6% and 1.3% in two of these years. It also occurred when we provided relief to municipalities with heavy debt loads, eliminated hospital and school board debt and allocated substantial money for hospital and school construction. We, as a government, are justifiably proud of this accomplishment.
For the third consecutive year we could have recorded a substantial surplus. But our objective is to manage responsibly, not only for the current year but also to achieve sound fiscal performance in future years. By budgeting prudently and controlling expenditures, we were rewarded with strong financial results. We used these to make needed strategic investments in public services and to create additional fiscal flexibility in the coming fiscal years. For example, while bettering our deficit targets each year, at the 1996-97 year end, we were able to invest $24 million to eliminate school board debt. Last year, at the 1997-98 year end, we could increase the amount for school construction to $50 million. And this year, before the 1998-99 year end we are allocating an additional $61 million to health care and funding other initiatives. At the same time, we have been selectively deferring revenue to future years when it will be needed to fund public services.
Strategic Year End Investments For 1998-99, federally estimated revenues were up by $195 million, while other provincial revenues were up by $10 million for a total revenue increase of $205 million. Government has used this additional revenue and the resulting flexibility to do several things:
Government determined that using these funds to reduce existing future obligations is the most prudent and responsible course of action. The money is being spent where it is most needed and in a manner consistent with our stated priorities. 1999-2000 Fiscal Outlook Mr. Speaker, for 1999-2000 our priorities remain health care, education and helping those most in need. We believe these reflect the priorities of our people. We believe this budget strikes the right balance between the need for programs and services and the need for sound financial management. This, of course, is the most difficult part of budget making. We do not have sufficient revenues to satisfy every demand. Although our economy should perform well, this will not translate into large revenue gains next year. Federal transfer payments, up sharply because of large prior year adjustments in 1998-99, will likely be lower in 1999-2000. We face growing expenditure pressures from many sectors just to keep providing existing service levels. Finding the right balance between demand for services and ability to pay is the only way to ensure that important public services can be maintained and enhanced over the longer term. The right balance will help create the conditions for sustainable balanced budgets in the future. The right balance in 1999-2000 is to run a modest deficit. This permits us to deliver our commitments to priority programs and services, to avert service cuts and layoffs and avoid higher taxes. There are no tax increases and no new taxes in this budget.
Our deficit is forecast to be $33.3 million. This is modest. It does not signal a return to the era of high deficits and mounting debt that preceded the 1995-96 fiscal year. The facts speak for themselves. Prior to 1995-96, a $33.3 million deficit would be lower than any achieved for any fiscal year since 1965-66, lower than any deficit in almost 30 years. We are including a $30 million contingency reserve. If the reserve is not used, we will, for all practical purposes, have a balanced budget. Public Sector Pensions In 1998-99 with the cooperation of our public servants, we succeeded in addressing the unfunded liabilities in our public sector pension plans. Government contributed $196 million to the plans in 1998-99, and over the next five years we will contribute an additional $670 million. These amounts are over and above our regular annual pension obligations. Government is contributing its portion of the unfunded liability and will continue to do so until all its obligations are met. Some of our employees have agreed to reduced benefits and with us are contributing higher premiums. |
|||||||||||||||||||||||||||||||||||||||||||||||||||||||||||||||||||||||||||||||||||||||||||||||||||||||||||||||||||||||||||||
|
|
|
All material copyright the Government of Newfoundland and Labrador. No unauthorized copying or redeployment permitted. The Government assumes no responsibility for the accuracy of any material deployed on an unauthorized server. Disclaimer/Copyright/Privacy Statement |