Real GDP grew by 5.3% in 2000, the third consecutive year that growth exceeded 5%. The recent economic gains have been driven by considerable growth in consumer spending, investment in the oil industry, and strong economic performance in key export industries.
|
| Selected Economic Indicators 1999-2001f |
| |
1999 |
2000 |
2001f |
| GDP at market prices ($m) |
12,110 |
14,074 |
14,152 |
| % change |
7.8 |
16.2 |
0.6 |
| GDP at market prices (92$m) |
11,259 |
11,852 |
12,083 |
| % change |
6.0 |
5.3 |
2.0 |
| Personal Income ($m) |
10,619 |
11,009 |
11,342 |
| % change |
2.5 |
3.7 |
3.0 |
| % change real |
1.0 |
0.7 |
0.8 |
| Personal Disposable Income ($m) |
8,450 |
8,868 |
9,189 |
| % change |
2.0 |
4.9 |
3.6 |
| % change real |
0.5 |
1.9 |
1.4 |
| Retail Trade ($m) |
4,223 |
4,495 |
4,639 |
| % change |
7.2 |
6.4 |
3.2 |
| % change real |
5.9 |
2.7 |
1.4 |
| Capital Investment ($m) |
3,502 |
3,218 |
3,065 |
| % change |
26.2 |
-8.1 |
-4.8 |
| % change real |
26.0 |
-4.7 |
-3.2 |
| Labour Force (000’s) |
246.7 |
245.6 |
247.0 |
| % change |
4.1 |
-0.4 |
0.6 |
| Employment (000’s) |
204.9 |
204.6 |
206.9 |
| % change |
5.5 |
-0.1 |
1.1 |
| Unemployment Rate (%) |
16.9 |
16.7 |
16.2 |
| Population (000’s) |
540.8 |
538.8 |
538.7 |
| % change |
-0.8 |
-0.4 |
0.0 |
| CPI (1992 = 100) |
110.0 |
113.3 |
115.8 |
| % change |
1.5 |
3.0 |
2.2 |
| Housing Starts |
1,371 |
1,459 |
1,533 |
| % change |
-5.4 |
6.4 |
5.0 |
Note: f: forecast (Government of Newfoundland and Labrador), March 2001.
Source: Statistics Canada; Canada Mortgage and Housing Corporation;
Economics and Statistics Branch, Department of Finance. |
|
| |
|
|
| Export value almost tripled in less than a decade |
 |
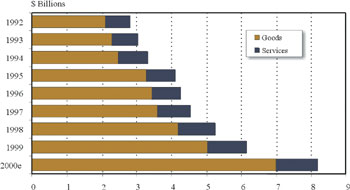 |
e: Department of Finance estimate
Source: Statistics Canada |
|
Exports accounted for over 60% of GDP growth last year, largely because of gains in oil. Offshore oil production totalled 52.8 million barrels in 2000, up 45% over 1999. Other
export sectorsalso contributed to growth. Iron ore production grew by 16.9% to its highest level since 1981 and newsprint production increased by 11.9% to reach a record high. Additionally, lumber production, non-resident tourism and other service sector exports recorded gains. Tourism benefitted from the Vikings! 1000 Years celebrations, resulting in a record of 426,250 visitors to the Province.
Consumer and business confidence have been bolstered by strong economic growth in recent years and this is reflected in increased retail trade. Retail sales grew by 6.4% in 2000, after a 7.2% expansion in 1999. Sales growth has also been driven by wage gains, tax cuts and pent-up demand from the mid-1990s. Personal income increased by 3.7% in 2000. As a result of personal tax reductions, disposable income grew by 4.9%.
Employment remained relatively stable in 2000 after growing by 9.6% over the previous three year period. Job gains were realized in the services sector, driven by increased consumer spending, tourism, business support services, and public service provision. However, these gains were offset by losses in the fishing and construction industries. The unemployment rate declined to 16.7%, the lowest rate since 1990. |
| |
| |
| Provincial Economic Overview continued on
next page. |
|
