 |
| |
 |
| |
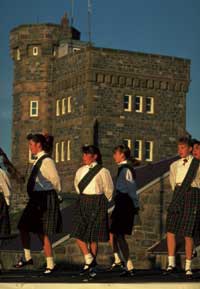
Photo: Department of Tourism, Culture and Recreation
In Newfoundland tartan kilts, the famous St. Pat’s Dancers perform in front of Cabot Tower |
| |
|
| |
 |
| |
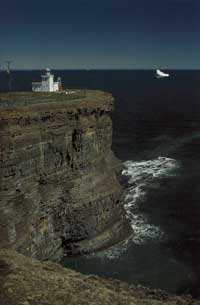
Photo: Brian C. Bursey
Lighthouse at Redmonds Head, Bell Island |
|
| |
$1992 Millions |
% of Total |
| Goods Producing Industries |
2,737 |
29.0 |
| |
| Primary |
1,110 |
11.8 |
| Agriculture & Related Services |
33 |
0.4 |
| Fishing & Trapping |
95 |
1.0 |
| Logging & Forestry |
75 |
0.8 |
| Mining, Quarrying & Oil Wells |
907 |
9.6 |
| |
| Manufacturing |
576 |
6.1 |
| Fish Products |
192 |
2.0 |
| Newsprint |
129 |
1.4 |
| Other Manufacturing |
256 |
2.7 |
| |
| Construction |
568 |
6.0 |
| Electric & Water Utilities |
483 |
5.1 |
| |
| Services Producing Industries |
6,695 |
71.0 |
| |
| Transportation & Storage |
484 |
5.1 |
| Communication |
436 |
4.6 |
| Wholesale & Retail Trade |
1,109 |
11.8 |
| Finance, Insurance & Real Estate |
1,388 |
14.7 |
| |
Community, Business &
Personal Services |
2,350 |
24.9 |
| Business Services |
318 |
3.4 |
| Health & Social Services |
690 |
7.3 |
| Educational Services |
719 |
7.6 |
| Accommodation, Food & Beverage |
237 |
2.5 |
| Other Service Industries |
385 |
4.1 |
| |
| Public Administration |
929 |
9.8 |
| |
| All Industries |
9,433 |
100.0 |
Notes: Based on the 1980 Standard Industrial Classification.
GDP is expressed at factor cost, measuring payments made to the owners of factor inputs
used in production. This differs from GDP at market prices, as shown
in the Provincial Economic Overview, which
represents the market value of total production. The difference is attributable to
indirect taxes and subsidies.
Newsprint estimates by the Economic Research and Analysis Division, Department of Finance.
Source: Statistics Canada; Economic Research and Analysis Division, Department of Finance |
|
|